Bode plot for the hydraulic actuator with
various phase weights
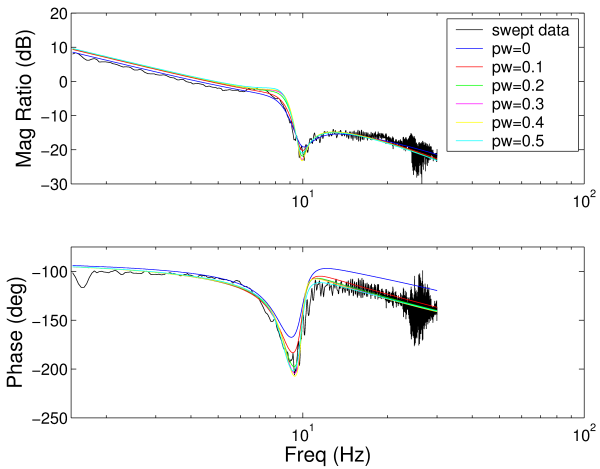
This figure shows a Bode plot for the hydraulic actuator. The black line is experimental data and the colored lines are from optimization curve fits with various values of the phase weight (0-0.5).
This figure shows a Bode plot for the hydraulic actuator. The black line is experimental data and the colored lines are from optimization curve fits with various values of the phase weight (0-0.5).
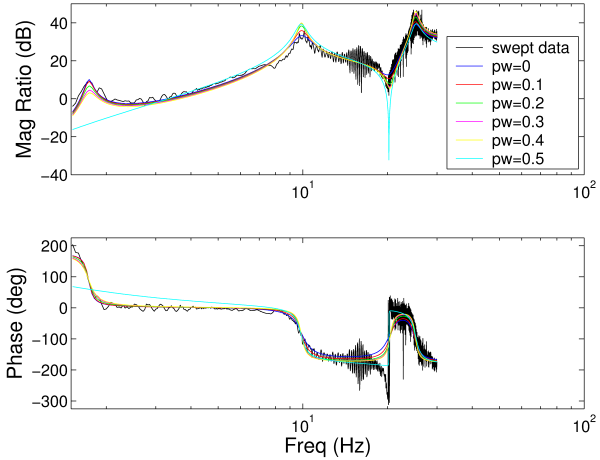
This figure shows a Bode plot for the flexible base. The black line is experimental data and the colored lines are from optimization curve fits with various values of the phase weight (0-0.5).
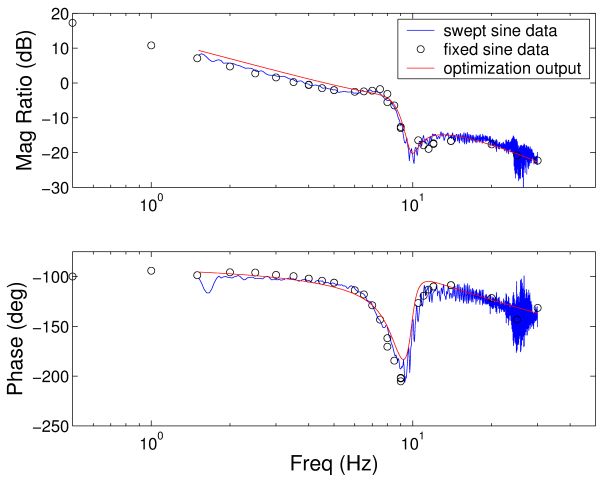
This figure shows a Bode plot for the hydraulic actuator. The blue line is experimental swept sine data and black circles are experimental fixed sine data. The red line is the output of an optimization with phase weight =0.1.
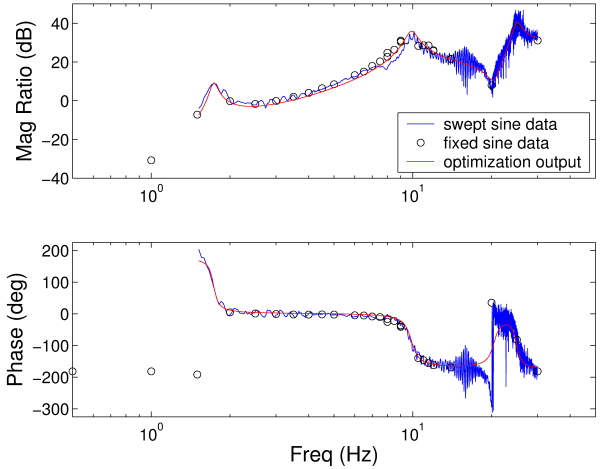
This figure shows a Bode plot for the flexible base. The blue line is experimental swept sine data and black circles are experimental fixed sine data. The red line is the output of an optimization with phase weight =0.1.